COVID-19 Data Analysis and Visualization
Skills
- • Python, Pandas, NumPy, Matplotlib, Selenium
- • Automated web scraping to streamline data acquisition for ongoing updates
- • Cleaning, structuring, and calculating important metrics (cases, deaths, cases per million, etc.)
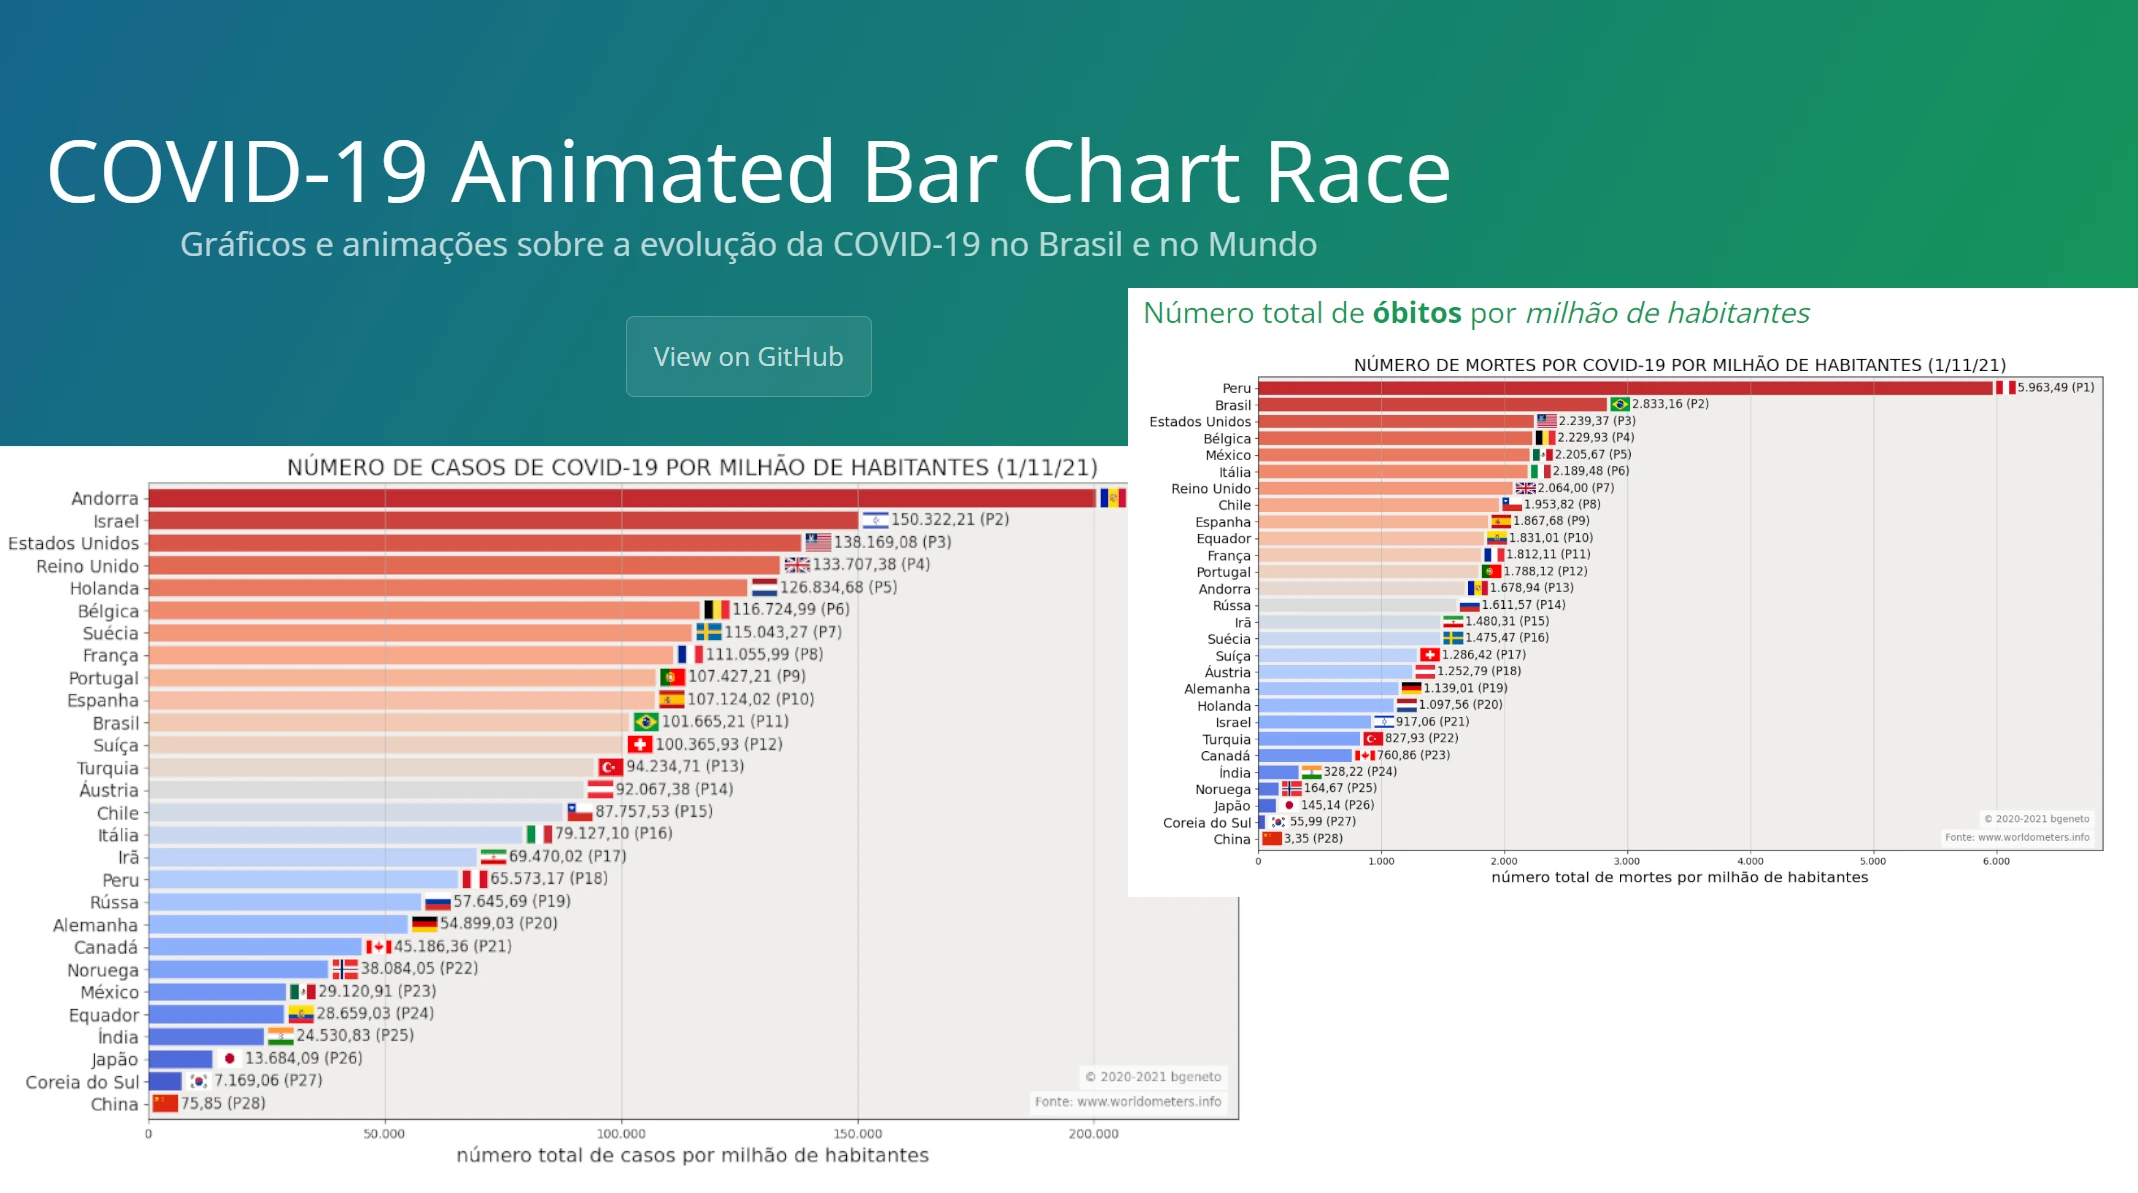
- • Static PNG graphs generation for snapshots
- • Dynamic MP4 bar chart races demonstrating the evolution of the pandemic over time
Description
The COVID-19 pandemic generated a massive need for clear and accessible data to track case numbers, trends, and impacts. So, at the very begging of the pandemic, I've Developed a Python-based web scraping script to gather worldwide COVID-19 data from reliable sources, process it, and present it in visually compelling ways. My expectation was to provide a tool for quick insights into COVID-19 statistics, potentially aiding public awareness and decision-making.
Year
2020